Line drawing of a police officer with a star badge on their chest and cap, hands pointing at the badge.

Samsung
Sports Experience

The social sports application aimed to revolutionize cross-device engagement among sports enthusiasts. With a comprehensive approach, the app provided access to a wealth of information, including detailed stats of past and recent games within the season, as well as all historical results. Beyond statistics, users could enjoy live streaming capabilities, bringing the thrill of the game to their fingertips. The integrated chat feature further enhanced the social aspect, enabling seamless communication among users, fostering a sense of community within the platform.

Sports by itself generates an incredible amount of data pre-game during and post-game that requires to be organized in a certain way for every sport but the goal for each discipline is the clarity and hierarchization of the most relevant information of the game, team or player. The first challenge was the ability to accommodate all data into the resolution given of the device that could be digested in a matter of seconds. This problem was not part of the TV experience, rather, the interaction with this device was limited, functionality had to be browsed and navigated using any remote control.

Rolls : Lead - UX / Visual / Motion / Production / Art Direction

A grayscale illustration of a person wearing a hoodie and cap, with a star symbol on the chest, in front of a Samsung logo.

Acknowledge of complexity


From day one, our goal was to build a single platform that handles immense data complexity—documenting every process end-to-end—while remaining intuitive enough for both rookies and pro fans. We needed to surface every key statistic from past, current, and live games across all sports and leagues, and to weave in a robust social layer for ongoing collaboration between internal teams, league partners, and broadcast partners.

Balancing Education and Expertise

Audience segmentation: We designed separate—but interoperable—flows for first-time fans and hardcore enthusiasts.

Account setup: A guided, device-agnostic onboarding walks users through setting preferences (personal details, favorite sports, teams, and players) at their own pace.

Customized libraries: Users can easily favorite leagues, teams, and athletes, and organize them into personal watchlists.

Deep-dive stats: A unified “Stats” hub lets you explore historical archives, track live-game metrics, and share insights in just a few taps.

Social engagement: Pre-, during, and post-game chat channels (text and voice) foster real-time conversations—whether you’re debating last night’s upset or organizing a watch party.

Seamless, Cross-Device Experience

We mapped out the entire content-discovery journey across smartphones, tablets, connected TVs, and desktops—identifying unique interaction patterns, usage contexts, and hardware constraints for each:

Mobile: Quick glances at live scores, push alerts on breaking news.

Tablet: Rich visualizations for mid-game analysis.

TV: Lean-back mode with “social overlaid” voice chat.

Desktop: Full-fledged data dashboards for power users.

Iterative, Collaborative Process

Every week, device-group engineers, UX researchers, and I co-created journey maps and ran targeted user-tests in two parallel cycles:

Feature validation: Rapid prototypes to solve immediate pain points.

Advanced analytics: Extended trials with pro-fan cohorts to refine deep-dive dashboards and custom queries.

Through daily stand-ups and cross-functional workshops, we continuously uncovered hidden requirements—whether a TV-friendly replay timeline or a mobile-optimized player comparison chart—ensuring our solution was both holistic and adaptable to diverse stakeholder needs.

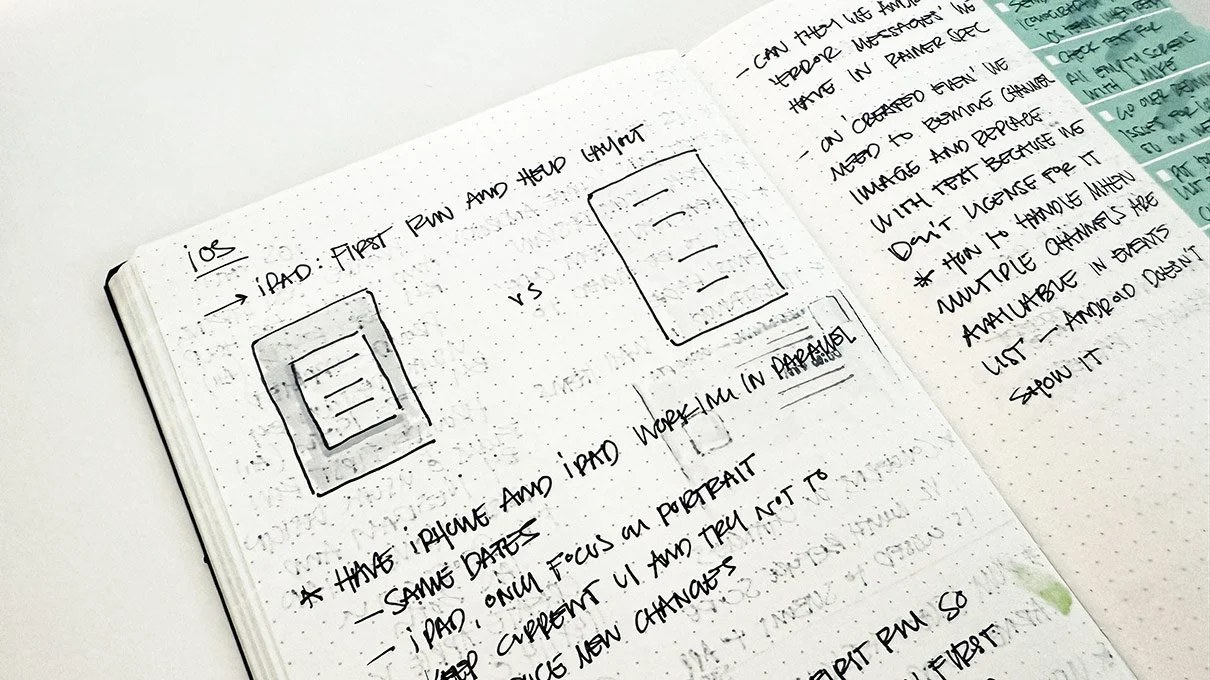
Analog First: Sketching as a Creative Catalyst


Writing down every thought, sketch, and idea on paper is one of the most valuable steps in my design process—a practice I find unique and increasingly rare among creatives. This tactile habit drives my workflow: it captures fleeting notions, sparks new ones, and keeps everything flowing smoothly. Watching a sketch come to life, then jumping straight into rapid prototyping and quick iterations, keeps my creativity in constant motion.

Open notebook with handwritten notes and diagrams related to specifications, with highlighted sections and annotations on what appears to be a planning or design layout.
A dotted grid notebook page with handwritten notes, diagrams, and highlighted sections about user interface design, including buttons, updates, and post creation.
Sketched wireframes and notes for a mobile app interface on dotted notebook paper, including screens with time, image, and text elements, along with annotations and design ideas.
Open notebook with handwritten notes on iOS development, to-do list, and design ideas, with an additional sticky note on the side.
Open notebook with handwritten notes and sketches about iOS, iPad, iPhone compatibility, with some text highlighted in turquoise.

UX Strategy


Part of my process is to define the interaction and in-app experience for have a guide and a top view of what is to be designed, for this app in particular I draw every possible screen and separate it by areas like Chat, FTU, Global Functionality, Games, and more with the intention to find out and verify that the amount of data to plug in had enough space to be displayed.

Diagram of a mobile app interface showing global functionality with three screens, labeled Top level, Swipe to slide out panel, and Sub-layer. The screens display lists of events and friends, counters for invitations and requests, and levels for navigation, with annotations and arrows clarifying features like slides, counters, and navigation layers.
Flowchart illustrating the process of opening an SSE application on a mobile device, including user authentication, agreement acceptance, navigation through welcome pages, and accessing the Samsung sports experience app.
Diagram of an active event ticker interface on a mobile app, showing navigation layers, event list, scoreboards, and ticker slides for real-time updates.
Wireframe of a mobile app interface for sports game gathering and chatting. It shows screens for friend groups, group chat, game selection, and game results, with options to add games and communicate with friends.
Flowchart of a mobile application interface for watching baseball games, including login screens, user account management, and viewing options with annotations describing features for MLB customers and premium members.
Wireframe showcasing a social app for managing and viewing sports groups and friend activities, including screens for group details, inviting friends, sharing events, and viewing watched friends.
Flowchart of a mobile app interface, illustrating features such as friend lists, game selection, group chats, watching with friends, favorites, test friend requests, and search functions, with annotations and navigation instructions.
Flowchart with instructions and diagrams illustrating how to navigate and stream videos on a mobile app, including logging in, creating accounts, editing video feeds, and switching between perspectives.

UI and Motion


Throughout the process, we explored multiple theming concepts—from light and dark modes to fully team-customizable palettes—ensuring that each design system was seamlessly implemented across every device in the ecosystem while rigorously adhering to accessibility standards.

At the same time, we experimented with diverse motion-design concepts to guide users through the platform’s hierarchy, elevating storytelling and introducing moments of delight. Each animation was carefully optimized to respect device-specific performance constraints and interaction models, delivering a cohesive, accessible experience everywhere

Screenshot of a sports app displaying score and chat functions for a baseball game between Atlanta and Baltimore, with options for audio chat and voice message controls.
Screenshots of a mobile app for a game, showing a baseball score and in-game chat features, with options for audio chat and voice message settings.
Screenshots of a mobile sports app showing live baseball game scores, team names, current inning details, and in-app chat features with a pop-up audio chat testing screen, and another showing audio chat settings with sliders for voice and microphone volume.
Three mobile app screens with sports team and avatar selection interfaces, featuring profile setup, avatar selection, and team selection options.
Mobile app screens showing baseball game highlights, stats, and commentary for a match between Atlanta and Baltimore, with player profiles and game updates.
Screenshots of a baseball game chat app with conversations among team members, showing scores, team names, and messages about the game and group chat activity.
Three mobile screens showing a sports app with a baseball game score, an error message, and a no scoreboard message. The first screen has text 'Follow the game with friends' and an illustration of two people sitting on a bench. The second screen shows an illustration of a hand holding an extension cord with the text 'Oops! connection error' and a refresh button. The third screen displays a digital scoreboard with the message 'No Scoreboard available yet' and a 'Find a Game' button.
Mobile screens showing a baseball player's profile, team stats, and career highlight. The profile is for Jered Weaver, a baseball player, with details including draft info, height, weight, value, and projected earnings.
Mobile app screenshots of a sports game chat interface, showing team scores, player icons, and voice chat controls.
Screenshots of a sports team mobile app with three stages: profile setup, selecting avatars, and choosing favorite teams, featuring black, yellow, and white color scheme.
Screenshots of a sports app showing baseball game highlights, player statistics, and commentary for a game between Atlanta Braves and Baltimore Orioles.
Screenshots of a mobile app showing live baseball game scores and chat discussion features for the Boston vs. New York Yankees game, with team logos, scores, and user chat conversations.
Mobile app screens showing a sports fan engagement app: the first screen shows a group chat invitation with grey illustrated figures and the text "Follow the game with Friends." The second screen indicates a connection error with a hand holding a plug and the message "Oops!, connection error." The third screen states no scoreboard is available yet with an illustration of two digital scoreboards and the message "No Scoreboard available yet."
Screenshots of a baseball player profile and stats app for Jered Weaver, showing his personal information, career stats, team roster, and a career display screen with his name.
Screenshots of a mobile app interface for a baseball game chat, showing in-game scores, player names, and an audio chat feature with volume controls, a list of audio participants, and a message input area.

TV Research findings


We found out during our research and user testing that navigating the system with the RC was an easy task, not many decisions to make other than d-pad and select, as long as the information and areas were accessible and legible to avoid user’s frustration. In fact, by adding the social aspect to the app was a positive feature to the challenges given, users were more interested to chat and bet with their friends while the game is on and checking the stats in-game.

A digital sports broadcast graphic showing baseball player stats and scores, including batting average, RBI, and pitch types, with a swooping silhouette of a batter in the center.
A television screen showing a baseball game featuring a batter at the plate, with score updates and scoreboard information on the right, including teams and scores.
Television screen displaying live sports scores and highlights, including a baseball player swinging a bat, and scores from multiple baseball, football, and basketball games.
A baseball game is being watched on a computer screen with video chat windows. A player from the New York Yankees is swinging at a pitch. The score is Atlanta 8, Baltimore 4, in the top of the 6th inning. Four people are in a video call on the right side of the screen.

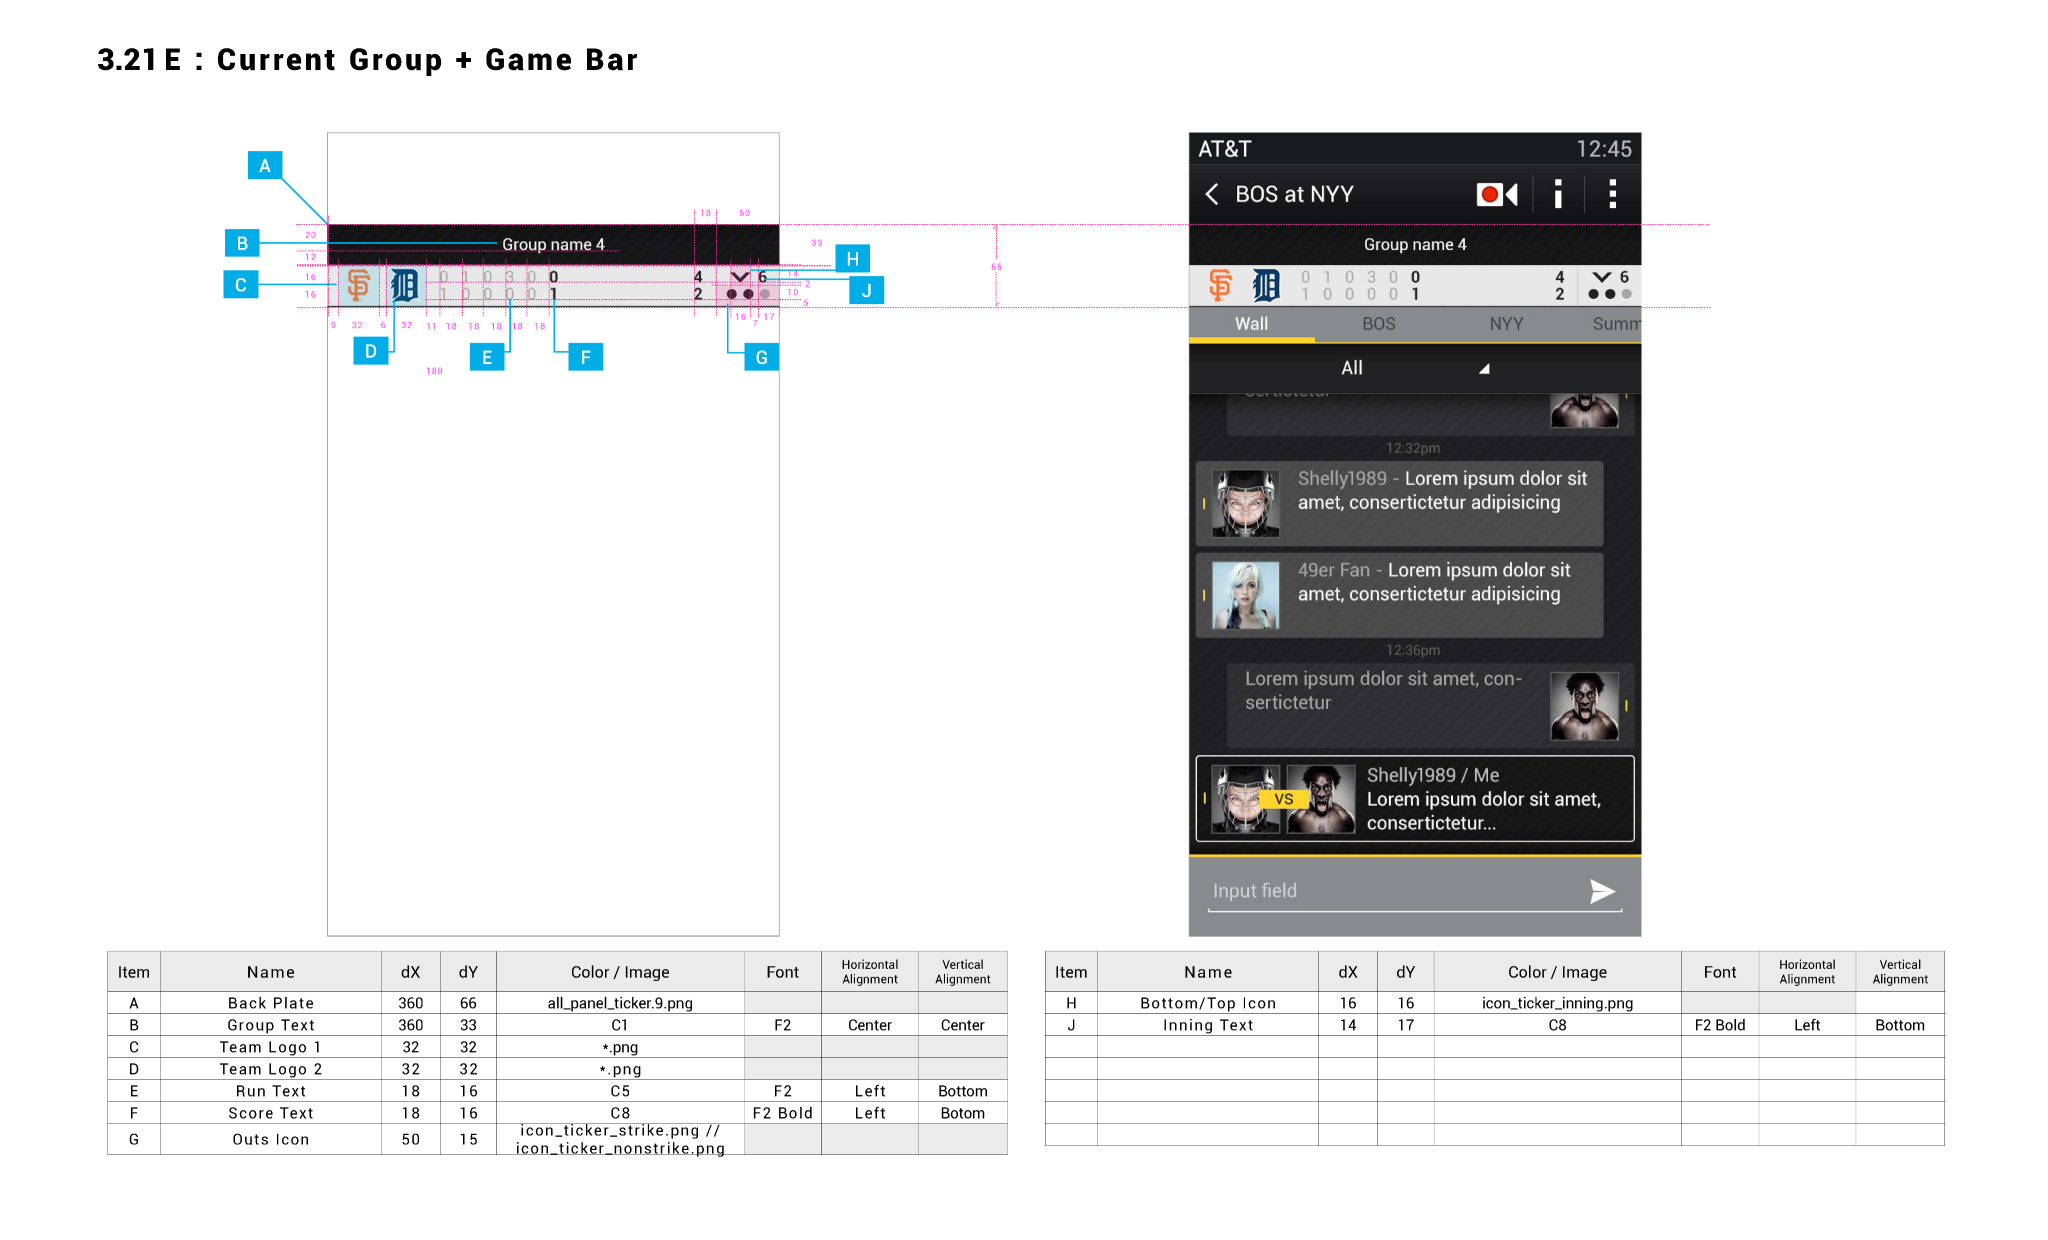
Redlines Method Pre-Figma/Sketch


Before Figma and Sketch there were redlines…We developed a streamlined process that simplifies the generation and updating of redlines. This efficient method allowed us to keep track of all modifications and updates, ensuring that nothing got overlooked. By integrating this process into our workflow, we were able to seamlessly hand off finalized redlines to the engineering team for further implementation. This meticulous approach not only enhanced our design capabilities but also ensured a smooth transition from design to development, facilitating collaboration and efficiency across teams.

A wireframe design for a mobile app screen showing a sports score interface with various icons and a chat conversation in the app. The wireframe includes annotations and a detailed item list describing each element's properties and placement.
Mobile sports app interface showing game scores, team logos, and chat messages, with annotations and measurement guides for design layout.
A technical diagram showing the layout and labeling of tabs in a mobile app, with a screenshot of a chat conversation about sports teams on the right side.
Screenshot of a mobile sports betting app showing a game between Boston and New York Yankees with live updates, a chat section displaying user comments, and a visual layout with labeled components, indicators, and a table of item details.
A diagram of a mobile app interface showing a conversation titled "BOS at NYY" with various status and input fields, and annotation labels pointing to different elements of the screen.
Design layout of a mobile app screen showing a sports betting interface with a menu overlay. The layout includes a backplate, filter text, filter icon, menu background, dividing line, and status indicators, with a design grid and specifications for each component.
Mobile sports betting app showing scores and betting options for a game between Boston and NYY with live updates and user comments. The app screen displays scores, time, and betting options at the top, with a list of user comments below, including one marked as declined.
Overlay diagram and screenshot comparing a scoreboard game tile design for a sports app. The diagram on the left shows measurements and element placements labeled with letters, while the screenshot on the right displays an app interface with game scores and schedules for Boston Red Sox versus Detroit Tigers.